

Rotativa.io Dashboard makes it easy to monitor your PDF docs activity. With a simple interface you can check your PDF usage situation.
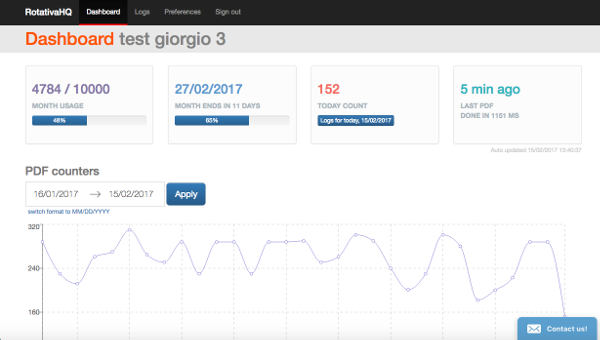
You will see 4 boxes containing info about:
- Percentage of your monthly PDF usage
- Percentage of current subscription month
- Day counter
- Last PDF data
A quick look at the progress bars will tell you if the current subscription plan is sufficient for your needs. If PDF usage is smaller then current month elapsed interval then the plan level is sufficient.
The data in the dashboard boxes is updated automatically every 30 seconds, you don’t need to reload the page. There’s an indication of the time when they were last updated.
The chart control enables to visualize PDF daily counters for custom date ranges. Clicking on a chart point will take you to the logs details for that day.
The logs page will show logs about individual PDF docs creations for a single date.
The preferences page will show you the ApiKeys and info about you subscription. If you are on a paid subscription you can switch plan, change account details or cancel.
The dashboard is a client side (SPA) application based on React (with Redux and RxJS). It is faster and more responsive, it should render well on tablets and smartphones.
Date (and time) format is configurable, once you set it by clicking on the link “switch format to …” it will use that format everywhere in the dashboard and it will be persistent across browser sessions.
We made the application internally and if you like it and need help to develop a client side javascript application yourself, you can hire us! Please drop us a line at info@vivasoftware.it, we will be happy to help you with full development, consultancy or training.